NOTES
ABOUT THIS PUBLICATION
This publication presents statistics relating to vehicles which were registered at 31 March 2007 with a motor vehicle registration authority. Motor vehicle registration statistics are compiled from data made available by various state and territory motor vehicle registration authorities and reflect the information as recorded in registration documents.
Estimates of the size and composition of the vehicle fleet were first published in 1921. However, it is only since 1971 that a Motor Vehicle Census (MVC) has been conducted on a more regular basis. The MVC has not been conducted in each and every year since 1971 and the census dates have varied over those years. Therefore, care should be taken when attempting to compare movements over the years.
Statistics are provided on vehicle types comprising passenger vehicles, campervans, light commercial vehicles, all types of trucks, buses and motorcycles.
Vehicle characteristic information includes make of vehicle, year of manufacture, type of fuel that the vehicle was registered as using; and for trucks, Gross Vehicle Mass or Gross Combination Mass. The size of the motor vehicle fleet is also compared with the estimated resident population.
INQUIRIES
For further information about these and related statistics, contact the National Information and Referral Service on 1300 135 070.
SUMMARY COMMENTARY
TOTAL NUMBER OF VEHICLES ON REGISTER
There were 14.8 million motor vehicles, including motor cycles, registered in Australia at 31 March 2007. This represents an increase of 2.9% since the 2006 Motor Vehicle Census (MVC), and an increase of 12.2% since the 2003 MVC, when there were 13.2 million vehicles registered in Australia. The average annual growth over this time was 2.9%.
Type of vehicle - Census years 2003, 2006 and 2007 |
|  |
 | 2003 | 2006 | 2007 | Change 03/07 | Change 06/07 | Average annual growth 03/07 |  |
 | no. | no. | no. | % | % | % |  |
|  |
| Passenger vehicles | 10 365 941 | 11 188 880 | 11 462 400 | 10.6 | 2.4 | 2.5 |  |
| Campervans | 38 337 | 41 520 | 43 266 | 12.9 | 4.2 | 3.1 |  |
| Light commercial vehicles | 1 879 755 | 2 114 333 | 2 189 559 | 16.5 | 3.6 | 3.9 |  |
| Rigid trucks | 348 673 | 383 546 | 394 491 | 13.1 | 2.9 | 3.1 |  |
| Articulated trucks | 64 261 | 71 680 | 74 444 | 15.8 | 3.9 | 3.7 |  |
| Non-freight carrying trucks | 18 599 | 20 293 | 21 247 | 14.2 | 4.7 | 3.4 |  |
| Buses | 70 122 | 75 375 | 77 548 | 10.6 | 2.9 | 2.5 |  |
| Motor cycles | 377 271 | 463 057 | 511 966 | 35.7 | 10.6 | 7.9 |  |
| Total motor vehicles | 13 162 959 | 14 358 684 | 14 774 921 | 12.2 | 2.9 | 2.9 |  |
|  |
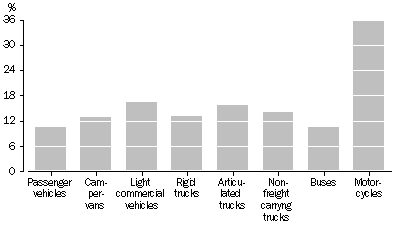
The passenger vehicle fleet has grown from 10.4 million in 2003 to 11.5 million in 2007, an increase of 10.6%. Motor cycles (35.7%) and light commercial vehicles (16.5%) were the vehicle types showing the largest growth over this time. Articulated trucks rose by 15.8%, non-freight carrying trucks rose by 14.2% and rigid trucks rose by 13.1%. Passenger vehicles and buses had the smallest growth over the same period, with both increasing by 10.6%.
Type of vehicle, Percent change
- Census years 2003 and 2007
STATES AND TERRITORIES
New South Wales had the largest share of the Australian fleet with 4.4 million (29.5% of the total) registered vehicles, followed by Victoria with 3.8 million (25.8%) and Queensland with 3.0 million (20.5%). The Northern Territory had the smallest share with 0.1 million (0.8%) registered vehicles. These shares are comparable with the distribution of the population across states and territories.
Motor vehicle registrations - Census years 2003, 2006 and 2007 |
|  |
 | 2003 | 2006 | 2007 | Change 03/07 | Change 06/07 | Average annual growth 03/07 |  |
 | no. | no. | no. | % | % | % |  |
|  |
| New South Wales | 3 944 850 | 4 268 631 | 4 361 237 | 10.6 | 2.2 | 2.5 |  |
| Victoria | 3 494 314 | 3 740 726 | 3 818 062 | 9.3 | 2.1 | 2.2 |  |
| Queensland | 2 552 061 | 2 897 867 | 3 033 417 | 18.9 | 4.7 | 4.4 |  |
| South Australia | 1 077 154 | 1 137 957 | 1 156 961 | 7.4 | 1.7 | 1.8 |  |
| Western Australia | 1 438 441 | 1 600 566 | 1 676 495 | 16.5 | 4.7 | 3.9 |  |
| Tasmania | 338 484 | 374 846 | 381 226 | 12.6 | 1.7 | 3.0 |  |
| Northern Territory | 104 259 | 114 015 | 118 178 | 13.4 | 3.7 | 3.2 |  |
| Australian Capital Territory | 213 396 | 224 076 | 229 345 | 7.5 | 2.4 | 1.8 |  |
| Australia | 13 162 959 | 14 358 684 | 14 774 921 | 12.2 | 2.9 | 2.9 |  |
|  |
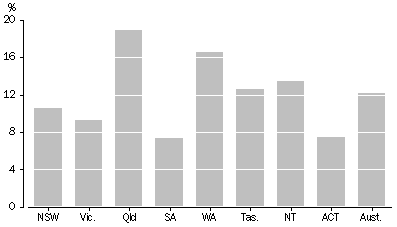
From 2003 to 2007, four states experienced growth above the national average of 12.2%. The motor vehicle fleet in Queensland showed the largest growth with a 18.9% increase compared with 2003, an average annual growth of 4.4%. Western Australia, Northern Territory and Tasmania increased 16.5%, 13.4% and 12.6% respectively compared with 2003, at average annual growth rates of 3.9%, 3.2% and 3.0% respectively. South Australia showed the smallest growth in fleet size since 2003 (7.4%), an average annual growth of 1.8%.
Motor vehicle registrations, Percent change
- Census years 2003 and 2007
VEHICLES AND RESIDENT POPULATION
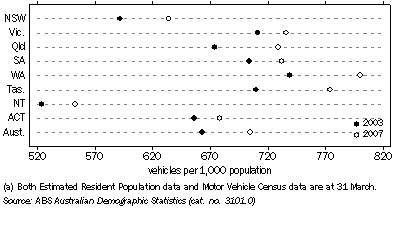
There were 705 motor vehicles per 1,000 resident population in Australia in 2007. This compares to 663 vehicles per 1,000 residents in 2003, representing an increase of 42 vehicles per 1,000 residents over this time.
Western Australia had the highest rate of all states and territories with 800 vehicles per 1,000 residents in 2007, while the Northern Territory had the lowest rate with 553 vehicles per 1,000 residents.
Motor vehicle fleet by population(a), State/territory of registration
AVERAGE AGE OF THE FLEET
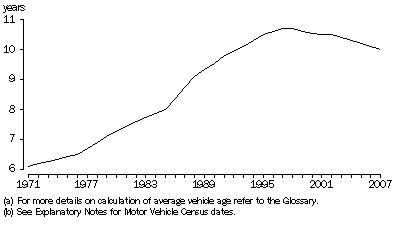
The average age of all vehicles registered in Australia at 31 March 2007 was 10.0 years. This is younger than the 10.4 years recorded in the 2003 MVC. Vehicles manufactured before 1992 (more than 15 years old) comprised 21.9% of the total Australian fleet.
The average age of all registered vehicles rose from 6.1 years in 1971 to 10.7 years in 1997, and has since fallen to 10.0 years in 2007.
Estimated Average Vehicle Age(a) of vehicle fleet(b)
Campervans were the oldest vehicles registered with an average age of 18.6 years, while motor cycles were the youngest vehicle type with an average age of 9.1 years.
The average age of passenger vehicles reduced from 10.1 years in 2003 to 9.7 years in 2007, with 20.2% of passenger vehicles manufactured before 1992.
Tasmania had the oldest fleet with an average age of 11.9 years and 31.5% of vehicles manufactured before 1992. This was followed by South Australia with an average age of 11.1 years and 27.1% manufactured before 1992. Northern Territory had the youngest fleet in Australia with an average age of 9.0 years and 17.9% of vehicles manufactured before 1992.
TYPE OF FUEL
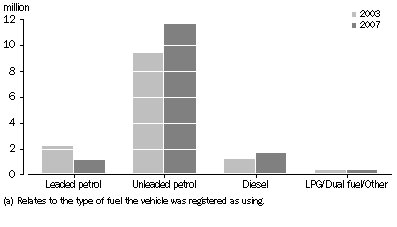
In 2007, there were 11.7 million vehicles in Australia (78.9% of the total vehicle fleet) that had been registered as using unleaded petrol, while 1.1 million vehicles (7.3%) have registered as using leaded petrol. In contrast, in 2003, there were 9.4 million vehicles (71.5%) registered as using unleaded petrol and 2.2 million vehicles (16.6%) registered as using leaded petrol. This represents an increase of 23.9% in unleaded petrol vehicles and a decrease of 50.7% in leaded petrol vehicles compared with 2003.
In 2007, the Australian Capital Territory had the highest proportion of vehicles (86.9%) registered as using unleaded petrol. Consistent with their older fleet, Tasmania had the highest proportion of vehicles (12.6%) registered as using leaded petrol.
Passenger vehicles comprised 85.9% of motor vehicles that were registered as using unleaded petrol and 69.7% of vehicles registered as using leaded petrol.
The number of vehicles registered as using diesel fuel made up 11.2% (or 1.7 million vehicles) of the total fleet, representing an increase of 34.5% since the 2003 MVC. The Northern Territory had the highest proportion of vehicles registered as using diesel fuel with 25.5%, while the Australian Capital Territory had the smallest proportion of diesel vehicles (4.7%).
Light commercial vehicles made up 42.1% of vehicles registered as using diesel fuel, while rigid and articulated trucks accounted for 21.3% and 4.4% respectively. Passenger vehicles registered as using diesel fuel increased by 47.0% since the 2003 MVC, and represented 26.3% of all diesel vehicles in 2007.
Motor vehicle fleet, Type of fuel(a)
CHARACTERISTICS OF THE FLEET
Passenger vehicles
Passenger vehicles accounted for 77.6% of all vehicles registered in Australia in 2007. The state/territory with the largest proportion of passenger vehicles was the Australian Capital Territory with 85.4%, while the Northern Territory had the smallest share with 64.0%.
All states and territories showed increases since 2003, with passenger vehicles registered in Queensland showing the largest increase (15.9%) and those registered in South Australia showing the smallest (6.2%).
A total of 6.1 million passenger vehicles were either Toyota, Holden or Ford. Respectively, these three makes accounted for 19.1%, 18.1% and 16.0% of the total passenger vehicle fleet registered at 31 March 2007.
Trucks
Rigid trucks accounted for 2.7% of all vehicles registered in Australia in 2007. The number of registrations for the heaviest rigid trucks (those with a gross vehicle mass (GVM) greater than 20 tonnes) has increased by 26.2% since 2003, while registrations for rigid trucks with a GVM of less than 20 tonnes increased by 10.6% over the same period.
Articulated trucks accounted for 0.5% of all vehicles on register in 2007. Articulated trucks with a gross combination mass (GCM) greater than 60 tonnes increased by 54.0% since 2003, while those with a GCM of up to 60 tonnes decreased in number (3.8%).
Victoria had the largest share (10,269) of articulated trucks with a GCM greater than 60 tonnes followed by Queensland with 9,868. Northern Territory had the highest percentage (79.4%) of articulated trucks with a GCM greater than 60 tonnes, compared to all articulated trucks for that state, followed by Queensland and Tasmania (both 59.0%). Queensland accounted for 60.6% of Australia's articulated truck fleet with a GCM of greater than 100 tonnes, with New South Wales the second highest at 14.3%.
Motor cycles
Motor cycles accounted for 3.5% of all vehicles registered in Australia in 2007, up slightly from 2.9% in 2003.
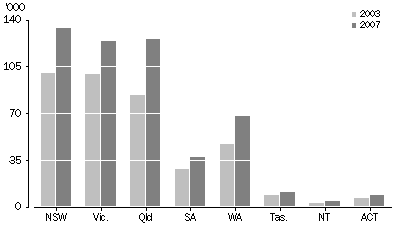
Australian motor cycle registrations increased 35.7% in 2007 compared with 2003. All states and territories recorded increases in registrations. Queensland recorded the largest increase (49.9%) followed by Western Australia (44.5%). The smallest increase was recorded in the Australian Capital Territory (23.8%) over this time.
Motor cycle fleet, State/territory of registration
 Print Page
 Print All